Regression
Regression analysis
regression simply describes the relationship between 1 independent variable and 1 or more dependent variables
- The details of their relationship is explained by some function
Linear regression is a marvelous tool, versatile, scalable, and as easy to execute as clicking a button on your spreadsheet. Whenever you want to understand which variables drive which other variables, and in which direction, it’s the first thing you reach for. And it works on any data set at all.
- But, like a table saw, if you use it without paying careful attention to what you’re doing, the results can be gruesome.
Regression analysis is good if you want to visualize the relationship between a dependent variable and 1+ independent variables
Y hat (written ŷ ) is the predicted value of y (the dependent variable) in a regression equation.
- It can also be considered to be the average value of the response variable.
Example: Stock price with S&P500 and Unemployment rate
We could use Regression analysis to anaylze the price of a stock (DV), and put it in the context of the S&P500 AND the unemployment rate (IV)
-
we can use these 3 sets of numbers as inputs into a regression function. The return value of that function is a formula that describes the relationship between that DV and IVs that you entered into the function
-
The formula is the equation for the Line of Best Fit
y = c + b1(x1) + b2(x2)y= DVc= constantx= IVb= regression coefficient- The coefficient represents the degree of change in
yfor each additional unit in that independent variable (x).- if S&P500
coefficient = 1, then $1 rise in S&P500 price can explain $1 rise in the stock.
- if S&P500
- The coefficient represents the degree of change in
-
Drawing from the above example, the stock price would be
y, S&P500 and UE rate would each be anx
Errors and Residuals
- Error - error is the difference between an observation and the population mean (ie. how it actually is in real life)
- since actually measuring population is very difficult, this number is more theoretical (ie. it is unobservable)
- Residual - residual is the difference between an observation and the sample mean
- making this number something we can actually figure out easily
- therefore the residual is an observed estimate of the error
- One can standardize statistical errors (especially of a normal distribution) in a z-score (or "standard score"), and standardize residuals in a t-statistic,
- each point on the graph has a value that equals the distance between it and the line.
- The line may be derived differently, and it really depends on what we are interesting in observing
- ex. we plotted it based on mean
- Error/Residual: the amount by which a single observation differs from its expected value (the LoBF)
- If we are using a population mean (ex. all stocks in stock market), then this distance is called the
Error- statistical errors are independent, and their sum within the random sample are never zero
- If we are using a sample mean (ex. all S&P500 stocks), then this distance is called the
Residual- the sum of the residuals within a random sample is necessarily zero - Therefore, the residuals are not independent.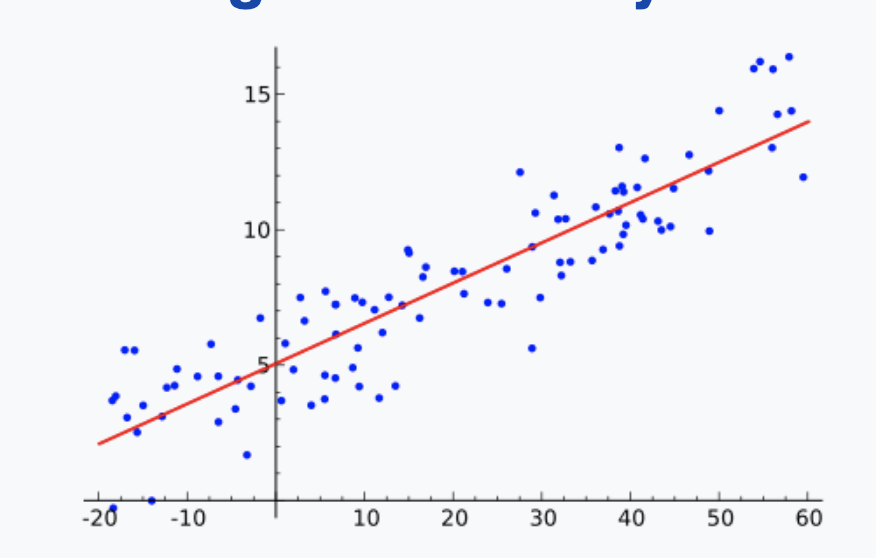
Line of best fit (LoBF)
- def - refers to an imaginary line that we draw through the points of data on a scatter plot.
- The closer the points on a scatter plot are to the LoBF, the more reliable the LoBF is for analysis
Least Squares Method
- used to determine the LoBF
- the method aims to create a straight line that minimizes the sum of the squares of the errors
Regression to the Mean (RttM)
- The phenomenon arising when an extreme sample has been drawn. When this occurs, future samples will be closer to the mean on further measurements
- ex. A QB throws 400 yards in one game. There is high statistical pressure on the QB to perform closer to the mean in his following game due to RttM
- This is because his breakout game was based upon probability, and since likelihood is more based around an average, odds are that the next game will be relatively toned down.
R-Squared
- purpose is to tell us how much of the variance of the dependent variable can be explained by the variance of the independent variable
- "out of the whole variance of a dependent variable, what portion is able to be explained by the independent variable?"
- therefore, if R-Squared = 0.5, this means that the model's inputs can explain about 50% of the variation
- In investing, R-Squared can tell us what percentage of a security's movements can be explained by movements in the whole market
- ex. We perform a regression analysis, setting our independent variable as GDP and dependent variable as our company's revenue. We find that R-Squared = 0.1, meaning that 10% of our revenue can be explained by movements in the GDP
- R-Squared only works as intended in a simple linear regression model with one explanatory variable. If we want to include multiple dependent variables, we must use adjusted R-squared.
- R-Squared is used closely with Beta. While R-Squared measures how closely a dependent variable is correlated to an independent variable, Beta measures how large those variations are
- According to Nassim Nicholas Taleb, R-Squared only exists in theoretical models, since it doesn't take into account unpredictable events
Ordinary Least Squares (OLS)
- def - a tool to estimate unknown parameters in a linear regression model
Linear Regression
Think of it like this. On a scatter plot, imagine all possible straight lines. For each line, calculate how closely it fits the dots, by measuring the distance of each dot from the line, and adding up all the distances after having squared them. Of all possible straight lines, the one that minimizes the sum of the squared dot-to-line distances, summed over all the dots, is the fitted regression line. It shows us the trend, without our eyes being distracted by all the mess of the individual points.