Candle Stick
Each candlestick is typically measured in increments of 1 minute, 5 minutes, hourly, daily or weekly
- with swing trading, daily or longer is typically used because your hold time will typically be measured in days or weeks or possibly even longer intervals.
each candlestick represents all four important pieces of information for that day:
- Stock open price (body)
- if candlestick is red, then the open is the top of the candlestick body (and vice versa)
- Stock close price (body)
- if candlestick is red, then the close is the bottom of the candlestick body (and vice versa)
- Stock high (wick)
- Stock low (wick)
Candlesticks do not just represent the price action of a stock during a period of time. When these candlesticks are put together in a timeline, they can also be thought of as a window that gives the trader some insight into the overall market sentiment or feeling about a stock’s perceived value.
Candlesticks are an important tool for a swing trader, because the candlestick chart reflects investor sentiment toward a stock (that is, whether investors overall think a stock will go up or go down). Your job as a swing trader of course, is to bet on if the stock will go up or go down.
If the asset closed higher than it opened, the body is hollow or unfilled, with the opening price at the bottom of the body and the closing price at the top. If the asset closed lower than it opened, the body is solid or filled, with the opening price at the top and the closing price at the bottom.
Generally, the longer the body of the candle, the more intense the trading.
The longer the hollow candlesticks are, the more bullish the market is. The longer the red candlesticks are, the more bearish the market
- Increasing volume relative to previous periods will confirm that the trend is strong. That is, increasing volume coupled with red candlesticks suggests a downward trend, and increasing volume coupled with hollow candlesticks suggests an upward trend.
A hollow candlewick with a short top wick is a bullish sign, while a red candlestick with a short bottom wick is a bearish sign.
Strategies
Reversal
The reversal strategy is one of the most consistent in predicting future price direction, especially when used in conjunction with other indicators
It's worthwhile also incorporating any news events that might be contributing to the reversal as confirmation of perceived momentum.
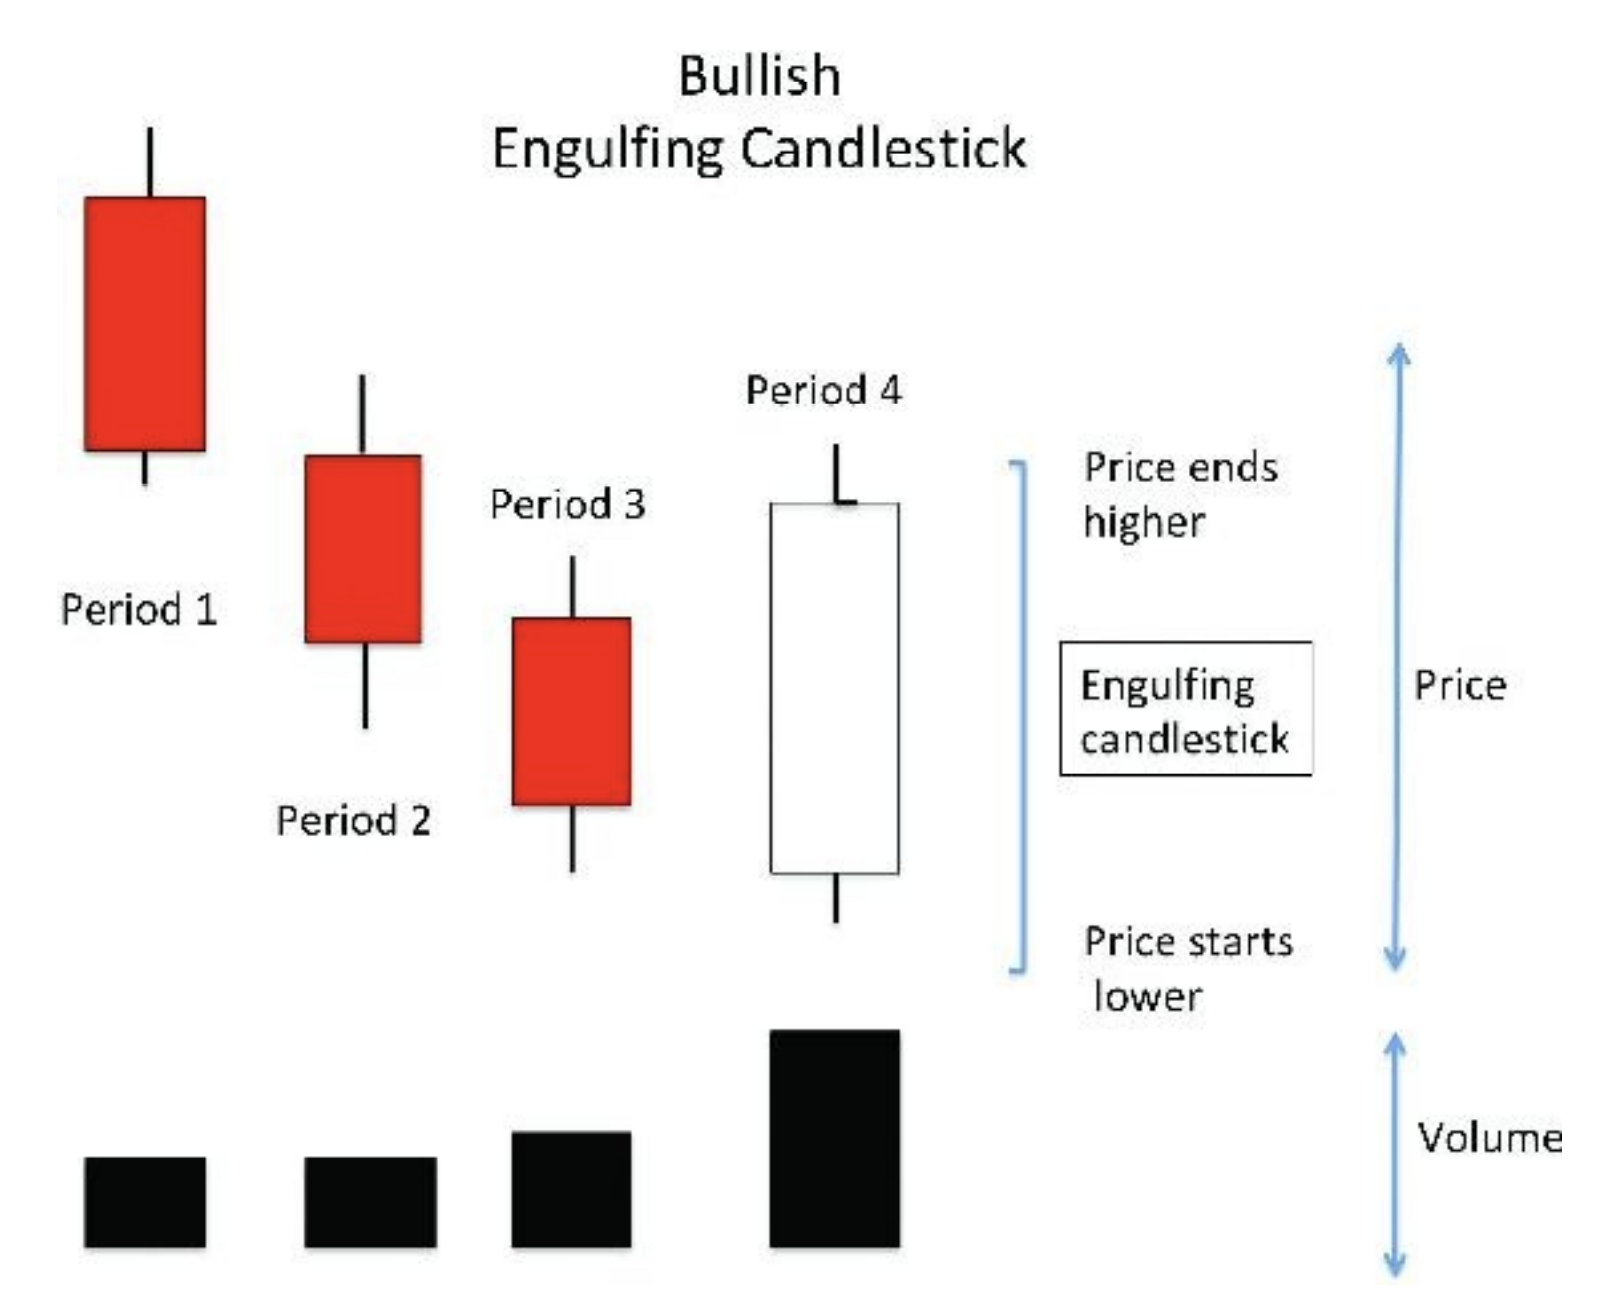
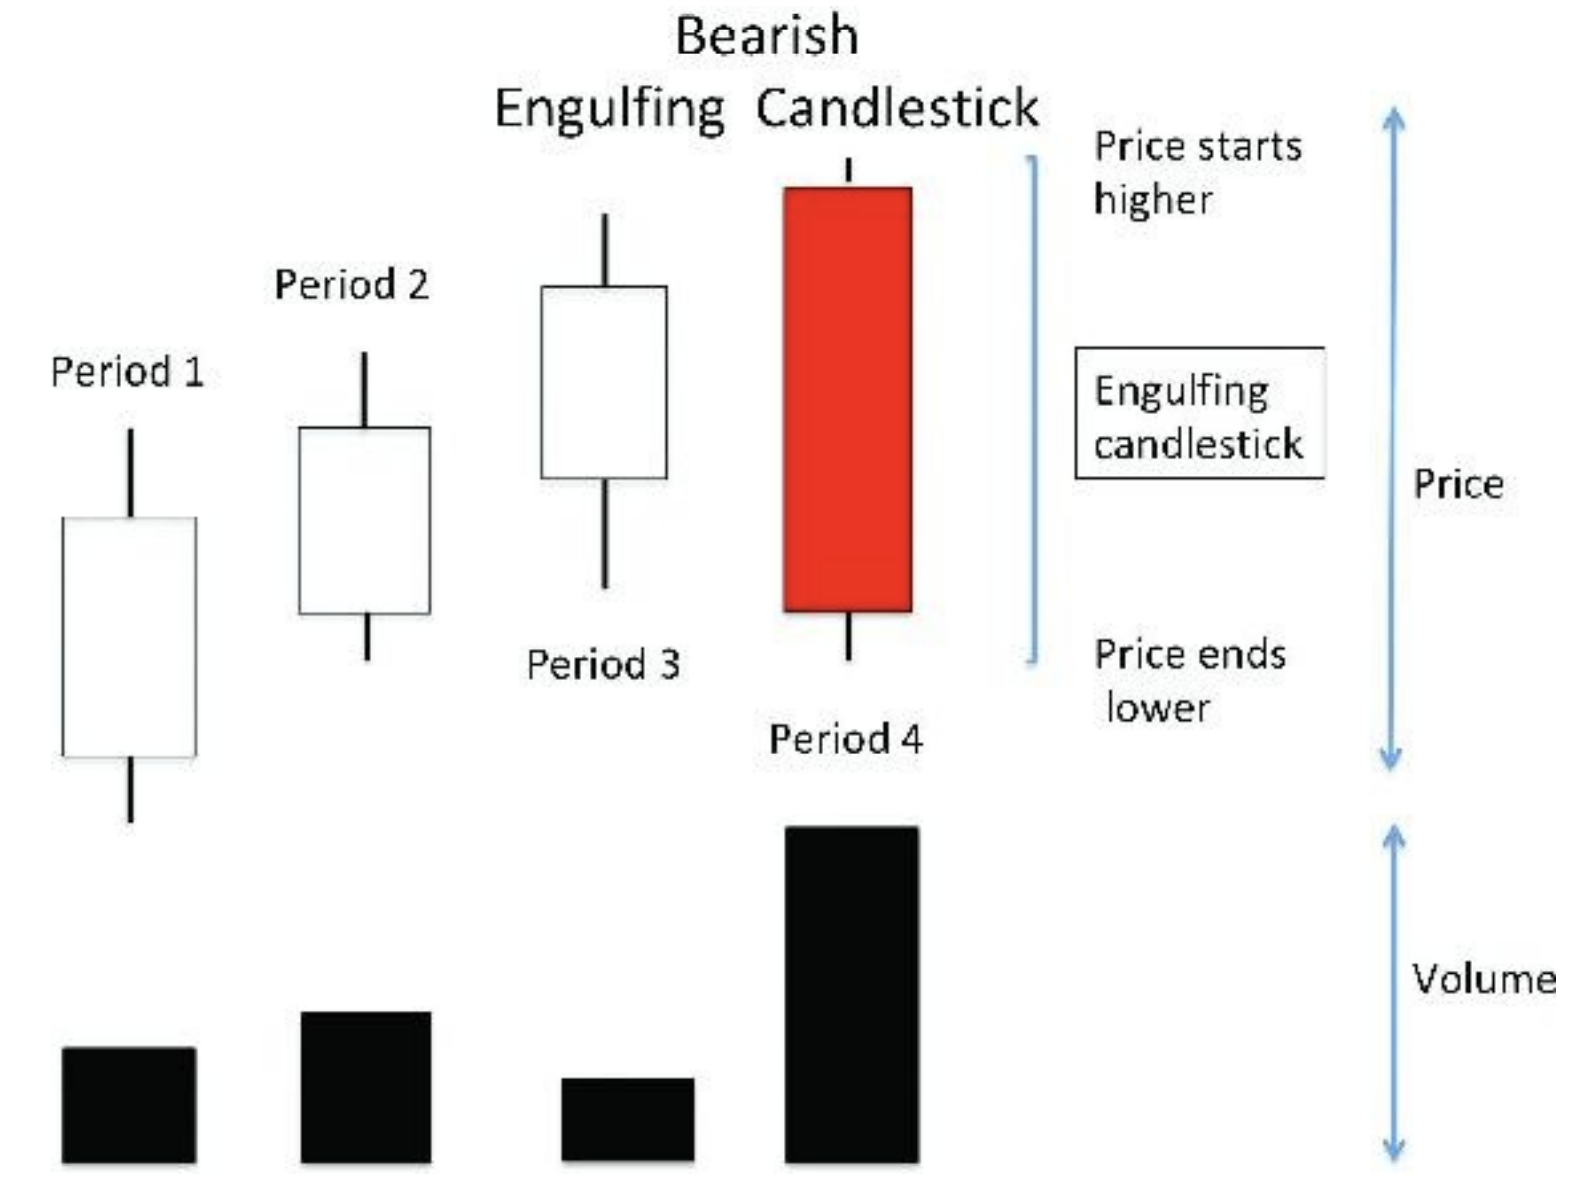
Engulfing Candle
This pattern illustrates a potential change in control between the buyers and sellers. It can be either bullish or bearish.
The pattern can be recognized as a short candle followed by a longer candle that is moving in the opposite direction of the previous price trend.
It is referred to as engulfing because (in the case of a bottom reversal) the price will start lower than the previous period’s close and end above the high of the previous period
- visually, the candlestick that reverses trend will have its lowest part lower, and highest part higher than the previous candlestick
- the smaller volume of the candle before reversal candle is important, because it indicates that the current buying (or selling) action is getting exhausted.
The high trading volume on the reversal candlestick is important, as it confirms a change in control.
It is important to get into a reversal trade early to ensure that you have the best possible risk to reward ratio.
With the engulfing pattern, if you are going to take a long trade, then your stop out price should be no lower than the low of the engulfing candle.
- Some traders might set the stop out price even higher, at the low of the previous candlestick that was engulfed.
Doji
A doji is a candlestick pattern that indicates indecision between buyers and sellers in a financial market. It's a small pattern with an opening and closing price that are almost identical, leading to a candlestick that has almost no body.
it is important to use other technical analysis tools as a confirmation of this reversal signal.
Traders should look at the volume of shares traded with the doji and compare that volume to the previous period – ideally the volume will be equal to or larger during the period that the doji occurred.
Similar to how you would trade an engulfing candle, the first objective is to get in as early as possible when you recognize the pattern appearing.
- ex. on a dragonfly doji, a swing trader could go long with their stop at the bottom of the tail. A tighter stop for a more conservative trader would be about 50% of the tail. Let’s say the stock started and finished the day at $25.00 with a tail tracing down to a $24.00 low of the day. That would put the 50% stop at $24.50. Recall that your reward needs to be at least 2 times the risk that you are taking, so for this price stop level, you would need to expect at least $1.00 in reward per share.
Harami Cross (top/bottom wicks of comparable length)
Sometimes a Doji will appear right before an engulfing candle, giving further confidence to the imminent reversal.
Gravestone and Dragonfly
A Gravestone Doji has its body at the bottom of the candlestick (ie. long top wick, no bottom wick, very small body), while a Dragonfly Doji has its body at the top of the candlestick (ie. long bottom wick, no top wick, very small body)
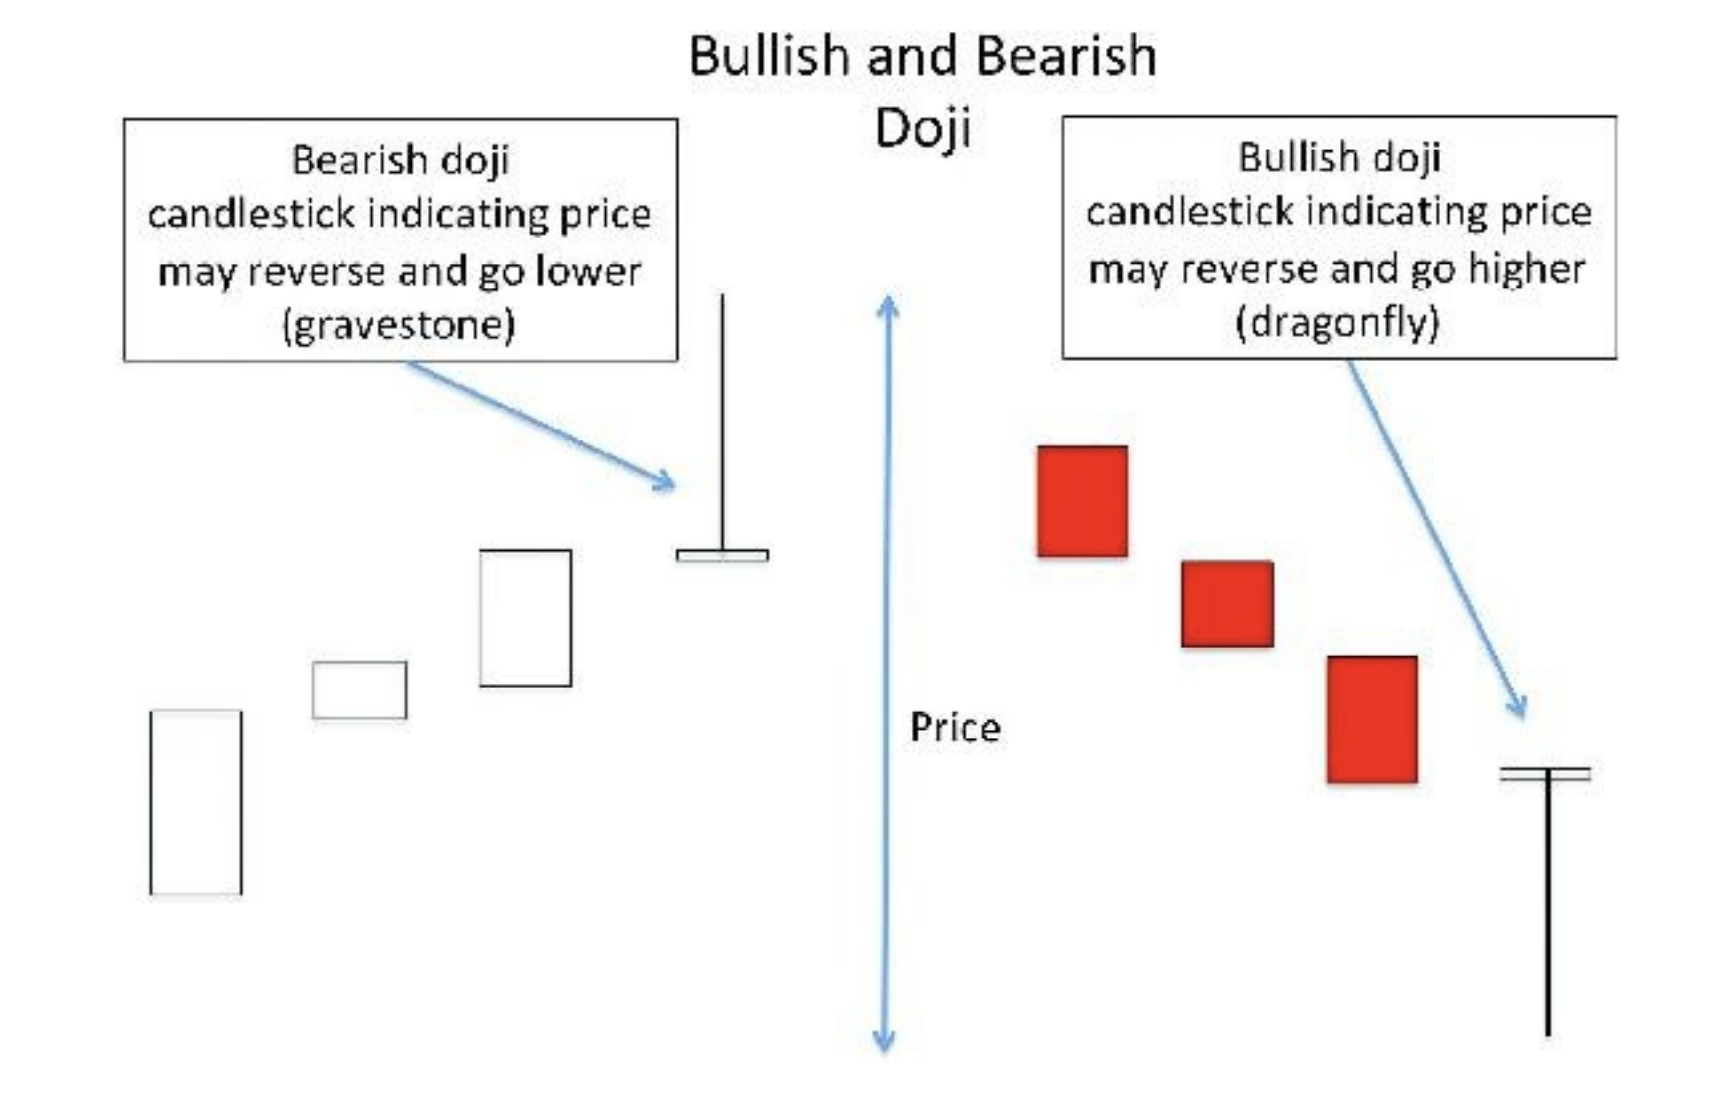
The gravestone doji can be found at the end of an uptrend as shown on the left side of the figure. The long upper tail suggests that the bulls took control early but later in the period it was the bears who were in control, pushing the price back down to the open.
The dragonfly doji is the opposite of the gravestone in that it is the bears who start out in control of the price by pushing it lower at the open. As the period continues, the bulls take control of the price movement, returning the price back to the open.
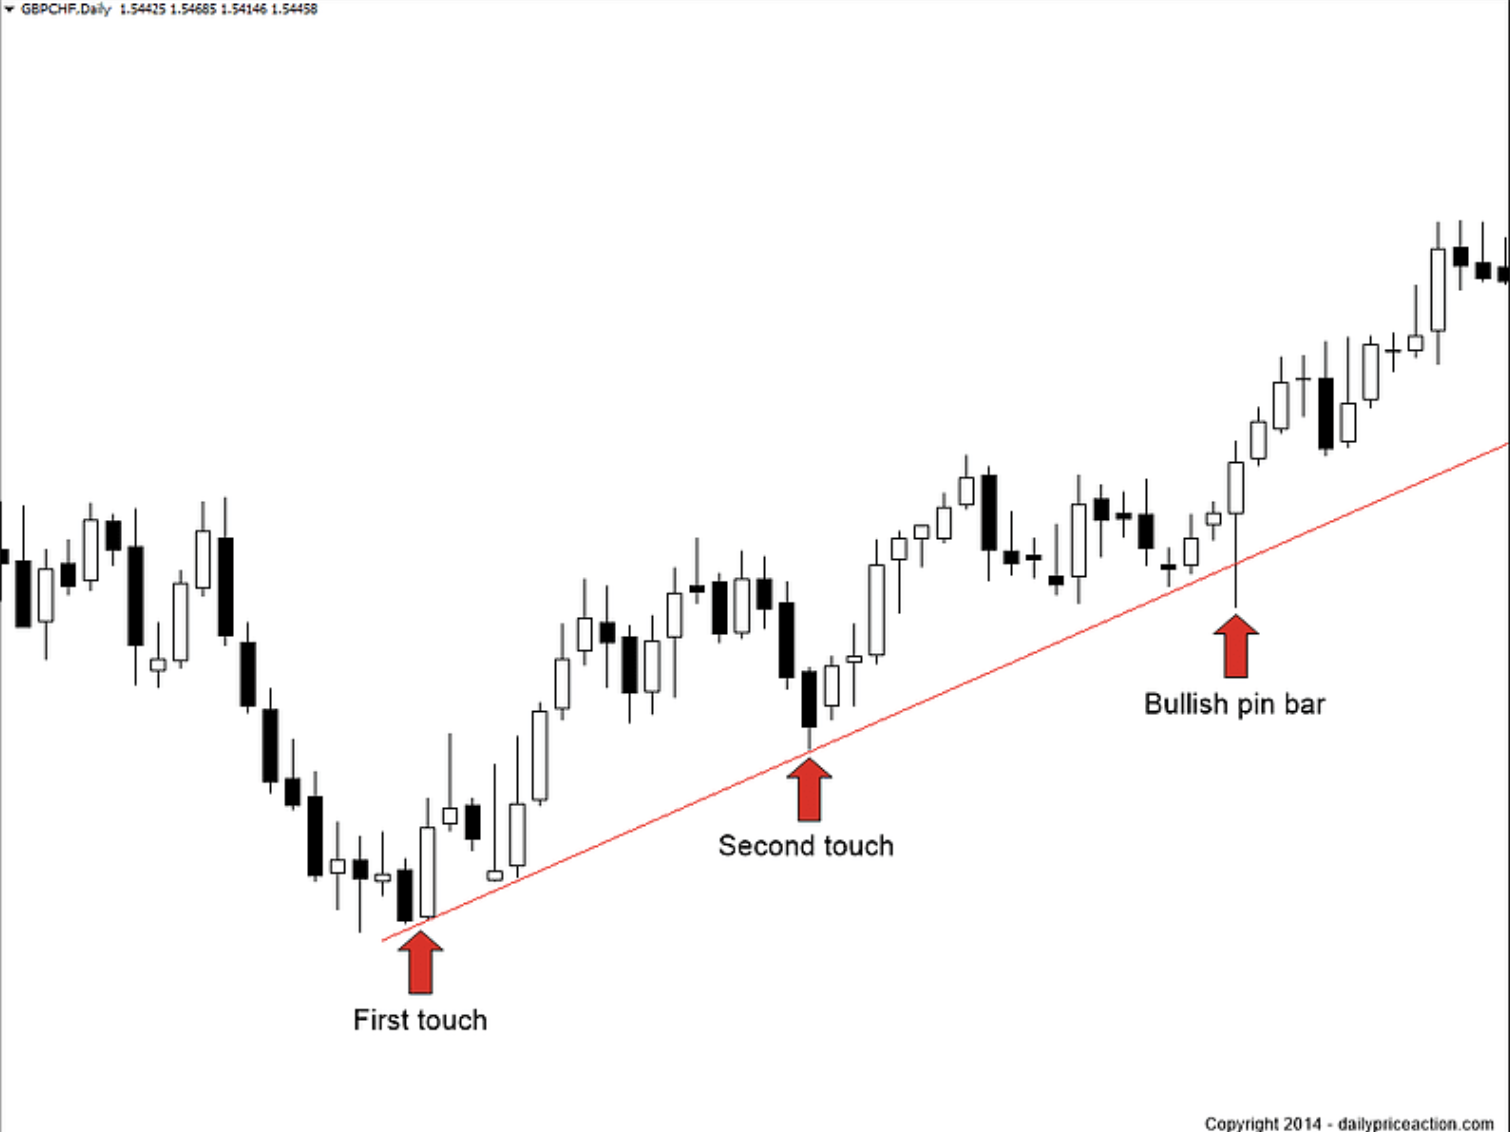
Bullish Pin Bar
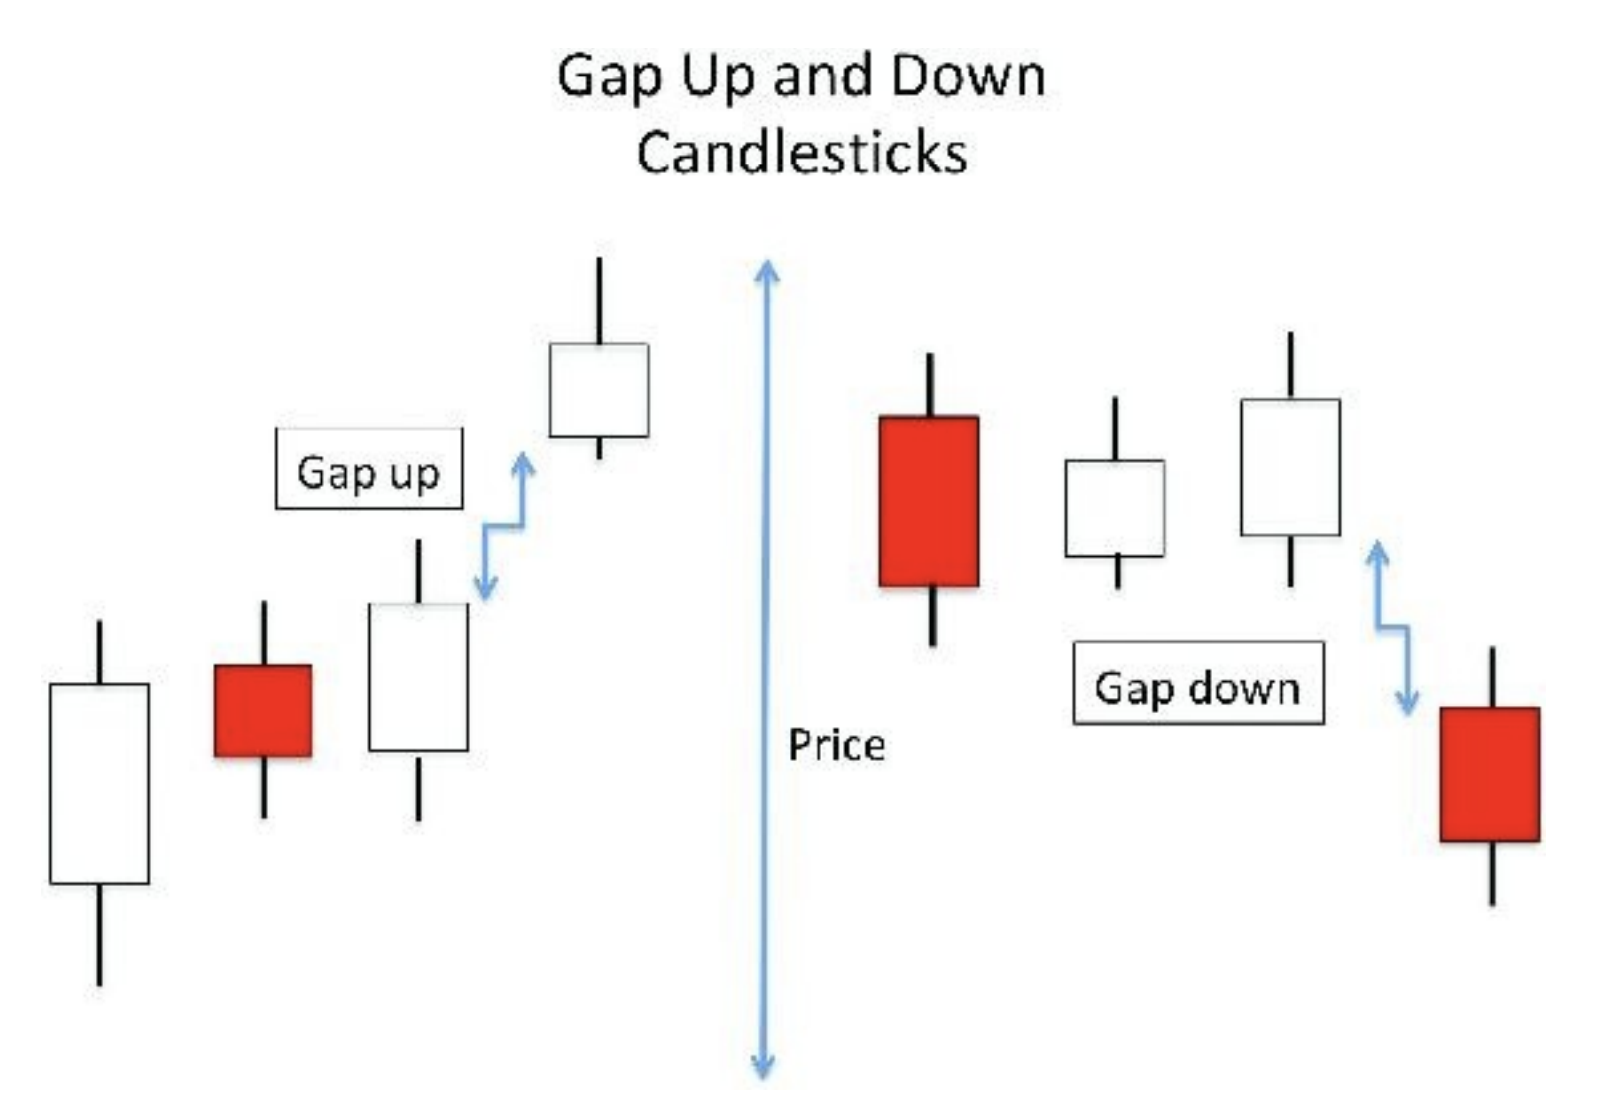
Gaps
Gapping price action normally occurs between trading sessions.
Larger gaps are usually caused by some new information that sharply impacts the stock price
For a swing trader, gaps can be difficult to trade after they have already happened. Gaps can result in overreactions to some news and those overreactions can last a day or they can last for several days.
- In an uptrending market, a swing trader can take a position during the first day of the gap up. They could take a position near the end of the day if the stock continues to trend higher and closes out the day close to or at the high.
- There is a good chance under this scenario (a strong market and a strong stock price action) that the price will gap up again on the following day.
After a gap has occurred, 1 of 3 things will happen:
- gap and go, which happens when it takes several days for the market to settle on a new valuation for the stock. This usually happens after a major announcement or event. Overly exuberant buying or selling will drive valuations to such extremes that an eventual pullback will occur.
- For stocks gapping higher, if there is a high number of traders holding short positions (over 20% of shares are shorted for example), then panic covering of these short positions creates additional buying that drives the price even higher (short squeeze)
- gap and consolidate. Some gaps are 1-day events and all of the news gets priced into the stock in the session immediately following the event. After that, the stock’s price will move sideways with a bit of up and down action as investors take profits or losses and new investors come in to take new positions. After a period of sideways consolidating price action, the price will start to move higher or lower. The direction the stock goes after consolidation depends considerably on the event and the overall market direction.
- If the news was good but the overall market is trending lower, then eventually the market direction may override the event and take the stock’s price lower. If the news has long-term implications for the stock (either positive or negative), the stock will likely continue to move in the direction of the gap after consolidation.
- gap and pullback (called "filling the gap"). Some gaps are not sustainable. Traders and investors will take profits in the gap and it is possible that short sellers will see an opportunity to sell high and buy low. Long traders will sell into a pop up in price and the short uptrend will reverse with the stock "filling the gap".
Another way to play gaps is to use the gap and fill principle. Often the points where a stock gapped higher or lower become, respectively, levels of resistance or support.
High-quality gap checklist
- Unexpected catalysts, like earnings beats, sudden profitability or FDA approvals.
- Break above resistance or new highs. Prioritize gaps that break through key resistance levels or reach new highs. At this point, the stock will face less selling pressure.
- Strong gap close. Strong closes near the high of day confirm big buying pressure and support. Be cautious when they fade, as it generally tells us there is not enough demand for a reliable follow through.
- Look for gaps of at least 5%, with as high as 10%. These high gaps show strong conviction from institutions.
- Look for gaps on unusually high volume, which proves that institutions are buying, giving stability to the move.
Backlinks