Moving average
Moving averages provide valuable information about volatility
- Volatility is lower when the stock is above a MA and vice versa
- This is more of a fundamental view to analysis, and technical adherents would probably disagree with the preceding sentiment.
The MA answers the question, "what if we took the high price of a stock each day over a period of time, and got the average of all of those highs?"
-
so to get a
5YearMA, we take the average of the 5-day highs surrounding the date we are applying it to.- ex. to get MA of
Year3, we would take the average of highs fromYear1toYear5. Carrying on, to get MA ofYear4we calculate the averages fromYear2toYear6. This is how we derive the trend line.
- ex. to get MA of
-
Moving averages filter out the “noise” from random short-term price fluctuations.
-
From a technical perspective, the MA is used to:
- identify trends
- if price > MA, upward trend
- if price < MA, downward trend
- identify support (floor) and resistance (ceiling) levels
- More technical traders set stop losses at Moving Average-current price differentials (ie. they find the stop-loss point by subtracting the MA from the current price). When the current price crosses the MA, it indicates the occurrence of a sell-off or buy-in
- identify trends
-
MAs with shorter time frames will react more sharply to price fluctuations
- Therefore, the lower the MA period, the closer the MA will track the actual stock price.
-
The MA line can be used as a support in order to determine when to time an entry
-
Traders also use the percentage of stocks in the market that are trading above their 200-day average as a gauge to determine the overall health of the stock market. The higher the percentage of stocks above their 200-day SMA, the more the overall market is biased to trending higher, therefore, the better trades for a swing trader may be long trades versus going short.
Determining a time period
- Typical periods: 10, 20, 50, 100 and 200, but these really are arbitrary.
- The longer the time period used, the more likely the average will lag behind a stock price in an uptrend or downtrend
- The most common periods used by swing traders are 20-day, 50-day and 200-day SMAs. Because traders are watching price movements in relation to these averages, they usually offer areas of support and resistance. The 200- day SMA is highly revered and normally provides the strongest level of support when a stock is selling off and the strongest level of resistance when a stock is starting to move higher from a low.
- As a rule of thumb, the longer your horizon is, the longer the period of MA you will use.
- This is because when you have a long-term view on a stock, you are more accepting of medium-term (~3-6 months) downturn periods.
- If you were to choose the wrong period, you would notice that you would be inclined to sell on premature hints of a downturn. In other words, you wouldn't be as willing to "weather the storm"
- This means that generally, volatility reduces the relevance of the MA. You pick a longer period to offset the amount that you "care" about volatility (remember: volatility only can exist in the context of a time-period, since a short-term trader sees a 5% daily swing as much more volatile a movement than an investor would view it).
- If you were to choose the wrong period, you would notice that you would be inclined to sell on premature hints of a downturn. In other words, you wouldn't be as willing to "weather the storm"
- This is because when you have a long-term view on a stock, you are more accepting of medium-term (~3-6 months) downturn periods.
- Longer MAs by nature have longer lag times, which impacts when we will consider something to be uptrend of downtrend.
- This makes sense, because "trend" only makes sense in the context of a time period. A long-term investor is more tolerant of midterm "downtrends", but to him, they don't matter because he is looking overall, and asking "what is the stock generally doing"?
Exponential Moving Average (EMA)
- more for intra-day traders
- gives more weight to more recent prices
- Therefore, it reacts more sharply to price changes than a SMA
- during times of higher volatility, this quicker reaction can also give the wrong signal.
- Due to the different levels of sensitivity between the 2 types of moving averages, you should consider adjusting which one to use based on the particular market environment. In volatile markets, where prices are bouncing up and down, an SMA may be a better tool. In less volatile market conditions, you would consider using the EMA to get earlier entry signals on trend changes.
Moving Average Convergence-Divergence (MACD)
- shows relationship between 2 different moving averages
- 12-period EMA minus 26-period EMA
- a 9-day EMA of the MACD (signal line) is plotted on graph
- Crossover - if MACD crosses above the signal line, it is a buying signal. If it falls below, it is selling signal.
- The speed of a crossover is a signal of how overbought/underbought a security is
- Crossover - if MACD crosses above the signal line, it is a buying signal. If it falls below, it is selling signal.
- MACD helps investors understand whether the bullish or bearish movement in the price is strengthening or weakening.
- Since EMA is used, more importance placed on recent price data
- MACD has a positive value when 12-period MA is above 26-period MA.
- spec: meaning the short term trend is surpassing the long-term trend
- MACD has a negative value when 12-period MA is below 26-period MA
- spec: indicating the end of a long term t
- when price of stock moves away from MACD (divergence), it indicates an end to the current trend
- If MACD is dramatically higher than longer trend, it indicates the security is overbought
Indicators
Crossover
- If you plot a short MA and a long MA together, you may be able to forecast an upcoming downward trend for the stock
- Again, the MA periods you choose depend on your investment horizon. If you are looking at long-term, then you should use longer period MAs. Ultimately, all investors should want to "sell before a downtrend and buy before an uptrend". Which trends matter is the question that you have to answer. Is this stock a long-term play? very-long-term? medium-long-term?
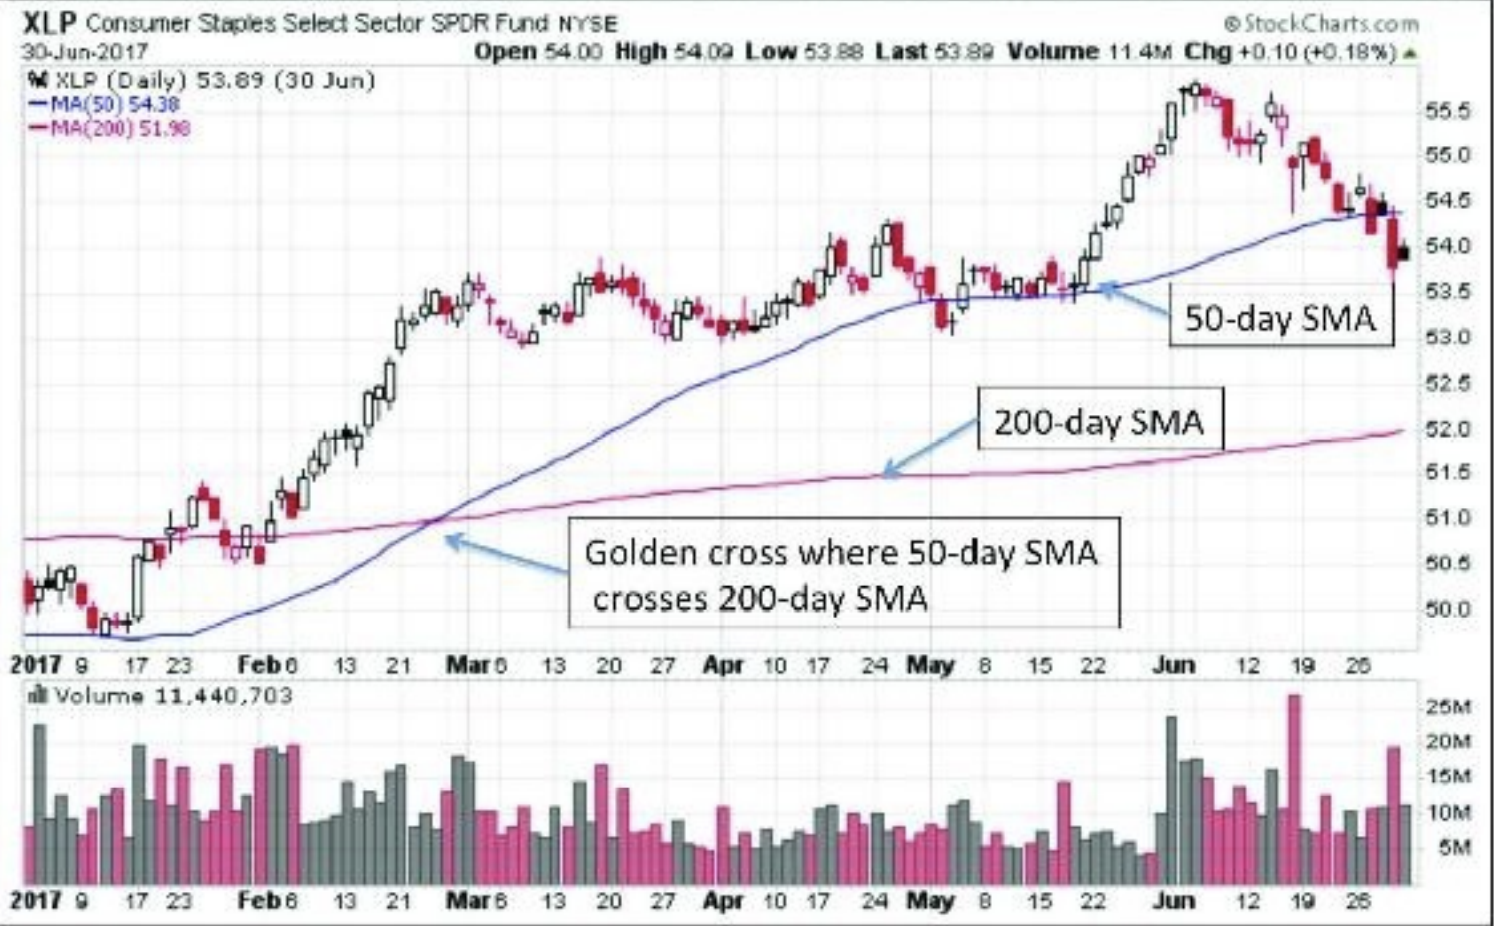
Golden Cross and Death Cross
A golden cross signal on this stock will occur when the 50-day SMA crosses the 200-day moving average from below to above. When this happens, it is an indication that the negative sentiment is possibly changing with the downtrend in price shifting to an uptrend. This cross happens because the 50- day SMA is reflecting more current price action while the 200-day SMA is lagging further behind, reflecting prices that are further in the past.
- Death Cross is the opposite
it is important to recognize that these events reflect longer-term trends. The signals are relatively late indicators because both of these moving averages are longer-term indicators and therefore they take longer to reflect changes in sentiment.
Moving Average Timing Model
- at the end of the month, see if index is still above the 200-day moving average. If yes, hold onto the stock. If it's below, sell it.
- at the end of each month, if the stock is below the 200-day moving average, sell it. Otherwise, hold onto it.